

Trading Basics
This page is what we wish someone had handed us when we started. No complicated jargon, no fluff. The essentials explained in plain language, in the order we recommend learning them.
What is trading?
Trading is simply buying and selling financial assets (currencies, gold, stocks, crypto) to profit from price changes. You buy when you expect a rise, and you sell (or open a short) when you expect a fall.
The difference from investing is the time horizon. An investor buys and forgets for years. A trader works shorter moves, from minutes to weeks. And the shorter the timeframe, the faster the pace and the heavier the psychological pressure.
In trading you can also benefit from falling prices, not only rising ones. A short trade means you open expecting price to drop, then you close by buying back cheaper. That idea feels upside down in week one, then it becomes normal.
And let's say it plainly from day one: trading is not a get-rich-quick scheme, and most people who come in with that mindset leave with losses. It's a skill built over time, like any profession. It takes learning, practice and discipline.
First: what is a candle anyway?
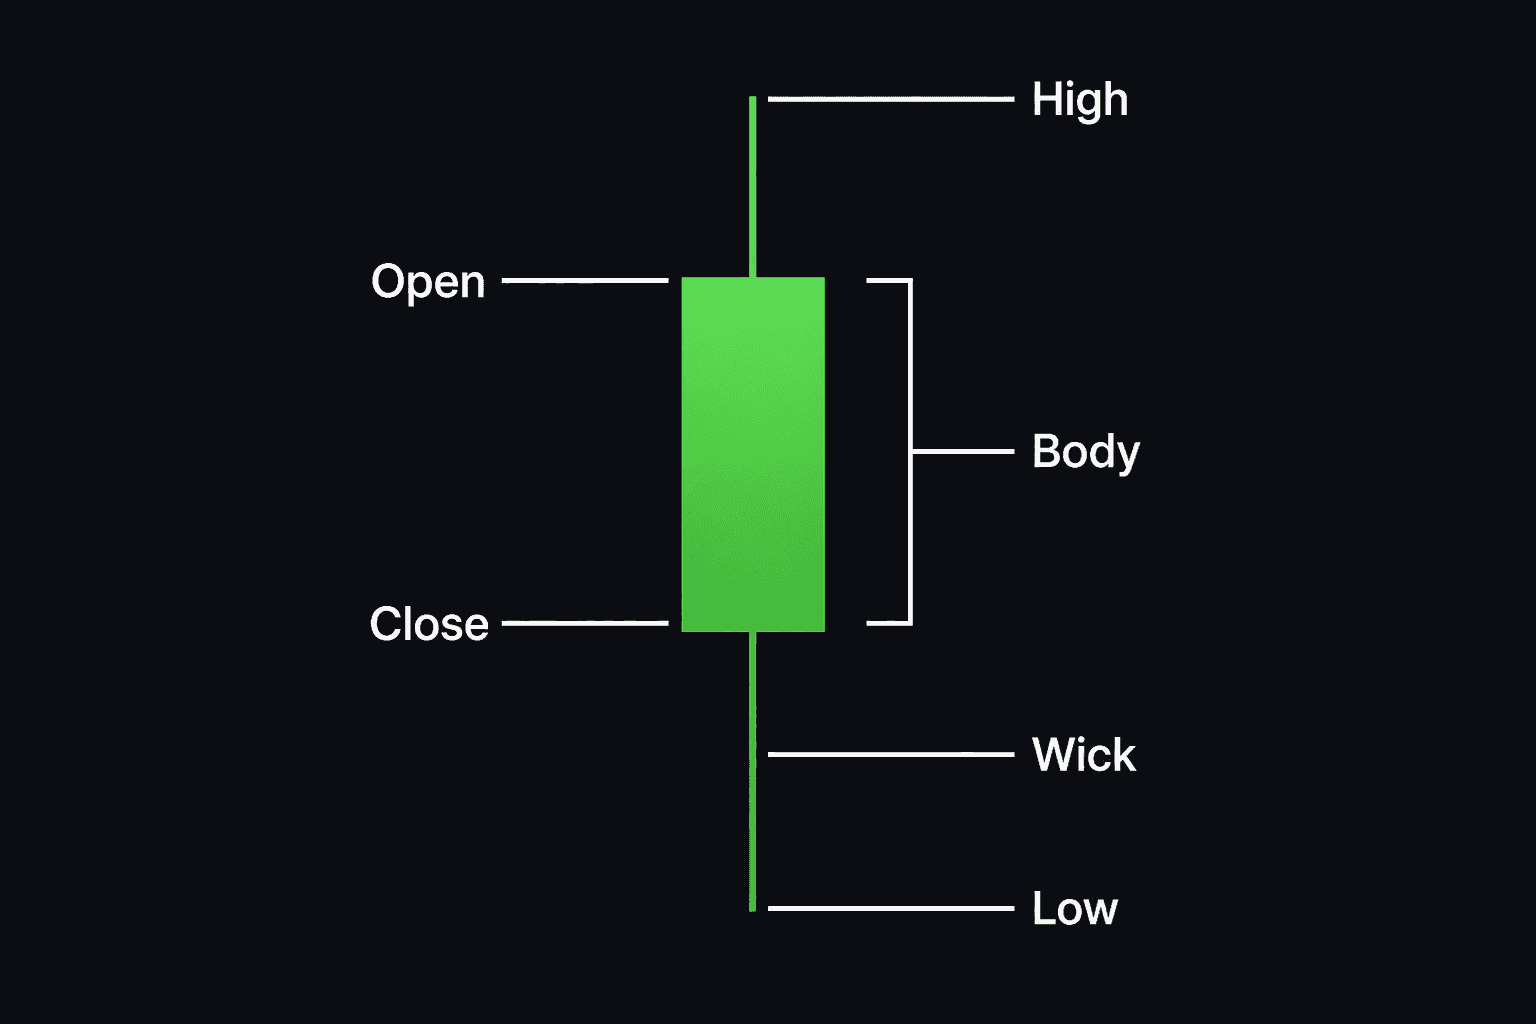
A Japanese candle is a summary of a battle between buyers and sellers over a period of time. A minute, an hour, a day, depending on your timeframe. The body shows where price opened and closed, and the wicks show how far price traveled during the battle before being pushed back.
A green (bullish) candle means the close is above the open, so buyers won that round. Red (bearish) means sellers were in control. The real story is in the details: a long body means clear dominance, a long wick means one side tried to take over and got firmly rejected.
Quick example: an hourly gold candle opens at 2320, trades down to 2312, then closes at 2328. Bullish body, lower wick. Reading: sellers tried to dump it, they could not hold price down, buyers closed the session higher. That is rejection, not just a pretty green bar.
Take this rule with you: a candle on its own means very little. A hammer at a strong support level is a respectable signal. The same candle in the middle of nowhere is worthless. Context is everything.
Candlestick patterns you need to know
These are the most common candles and patterns you'll see on any chart. The drawing shows the shape, and the text tells you the story behind it. Always remember: a candle without context means nothing.
Doji
Open and close are almost the same. A draw between the two sides and hesitation in the market. After a long trend, it can be the first hint that the dominant side is getting tired. We do not trade it alone. We wait for the next candle to confirm.
Hammer
Appears after a decline. Sellers pushed price down hard, but buyers fought back and closed near the top. That long lower wick is the rejection. A potential bullish reversal, especially at support that already bounced once.
Inverted Hammer
After a decline: buyers tried to push price up and got pressed back down, but the attempt itself is a change in behavior. It needs confirmation from the next candle before acting. If the next bar closes above its high, the case gets clearer.
Shooting Star
The mirror of the inverted hammer: it appears after a rally. Buyers tried to continue up and were strongly rejected. The long upper wick documents it. A potential bearish reversal at resistance, stronger if the next candle breaks the shooting star close.
Hanging Man
Looks exactly like a hammer but appears after a rally, and that flips the story. Heavy selling showing up mid-session after an uptrend is an early warning that control may be shifting. Plenty of people get fooled by the shape and treat it as a buy hammer.
Bullish Engulfing
A green candle that completely swallows the body of the previous red one. Buyers did not just stop the decline, they flipped the table in one session. One of the stronger bullish reversals when it prints at support or after a clear run down.
Bearish Engulfing
The bearish equivalent: a big red candle covering the previous green body. When it prints at a top or a resistance, sellers are announcing they have taken the wheel. The logical stop sits above the engulfing high, not inside the body.
Morning Star
A story in three acts: a strong decline, then a small hesitant candle (momentum lost), then a strong bullish candle confirming the reversal. More reliable on higher timeframes like 4H and daily.
Evening Star
The opposite of the morning star: a strong rally, hesitation at the top, then a strong bearish candle. The message is clear, the bullish party is over, at least for now. Works better if the high tagged a weekly resistance.
Marubozu
A full body with almost no wicks: one side controlled the session from open to close without resistance. It signals clear directional strength and often shows up on breaks of important levels. Shorting it halfway through is usually late.
Timeframes
Every candle on the chart represents a duration. On a 1-minute chart, each candle is one minute. On the daily, each candle is a full day. Same pair, same market, different story depending on the zoom level.
A common mistake: you read a clear uptrend on the daily, then you take a 1-minute pin bar against that daily because it looked pretty. Then the tiny move gets steamrolled. The simple fix: decide the higher-timeframe direction, and execute the lower-timeframe trigger in the same direction.
A practical stack we use a lot: daily or 4H for bias, 1H for the zone, 15m or 5m for the entry. You do not have to copy the numbers. You do need one frame for the picture and one frame for execution.
Support and resistance
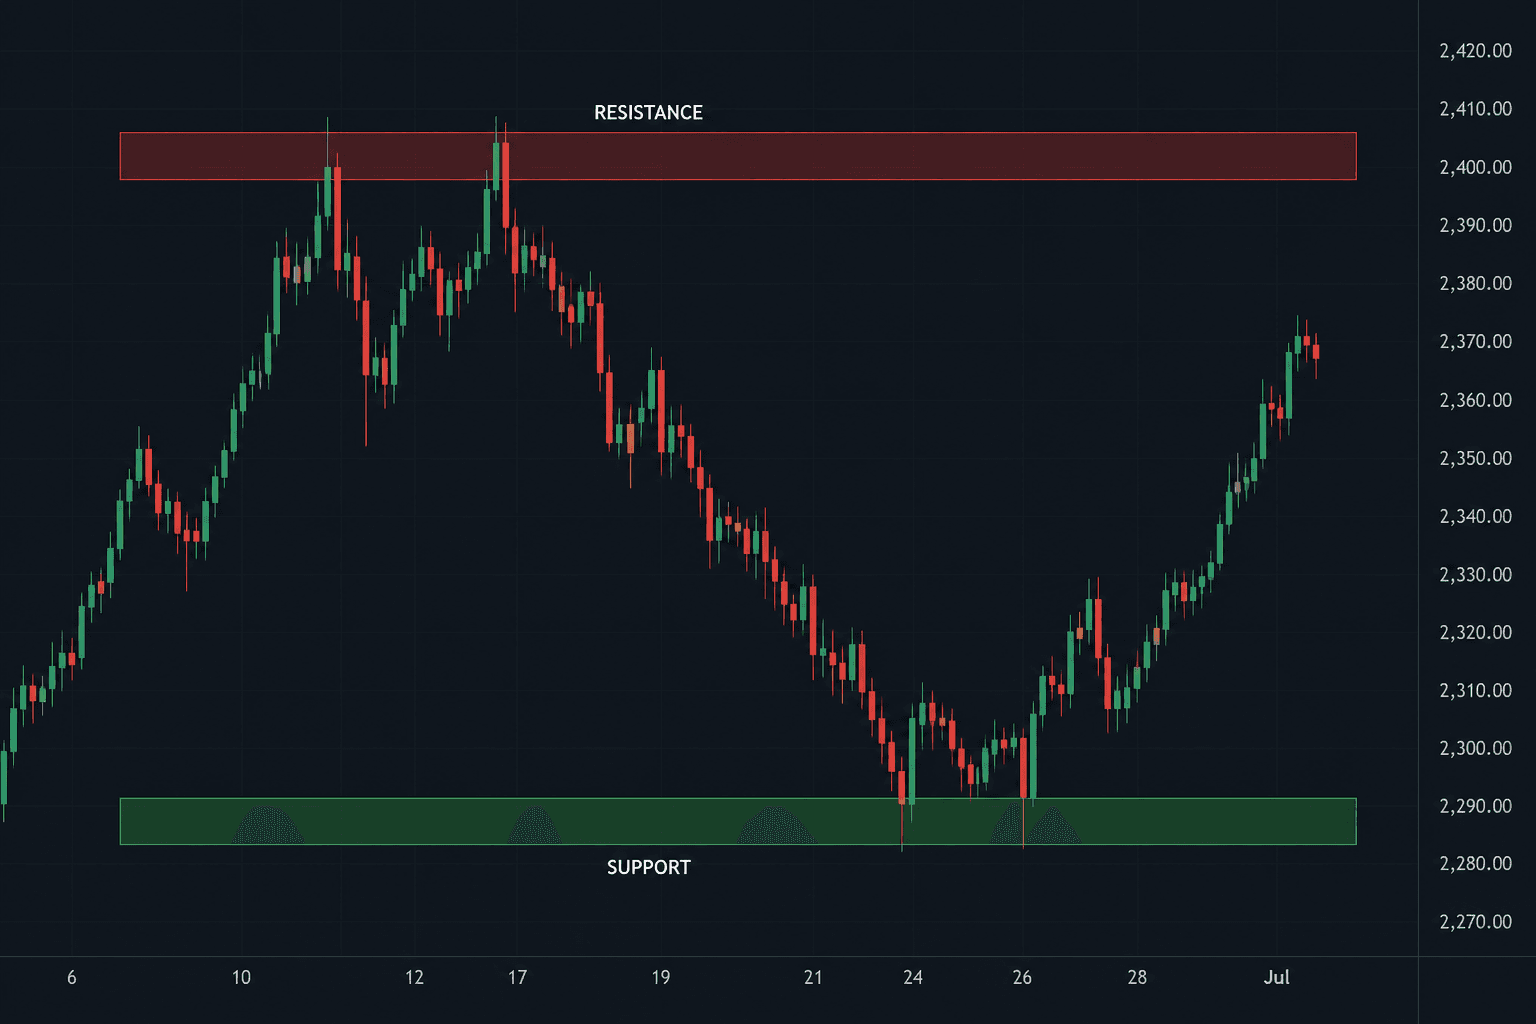
If there's one concept that must become second nature in your first week, it's this. Support is an area where buyers previously stepped in and stopped a decline. Resistance is where sellers gathered and capped a rally. Markets have memory, and people remember prices where something important happened.
On the picture: price tagged the green zone more than once and bounced, so there is real demand there. It tagged the red zone and got rejected, so there is supply. When you trade, you ask: are we near a remembered area, or in the middle of nothing?
Two practical notes. First, these are zones, not millimeter-thin lines, so draw them as areas. Second, when resistance genuinely breaks it tends to become support, and vice versa. This role-flip is one of the most frequently repeating ideas you'll see on any chart.
How do you know a break is real? A clear close beyond the zone on the timeframe you trade, then sometimes a retest from the other side. A wick through the zone with no close is often a lie. Those wicks are what trap beginners.
The trend
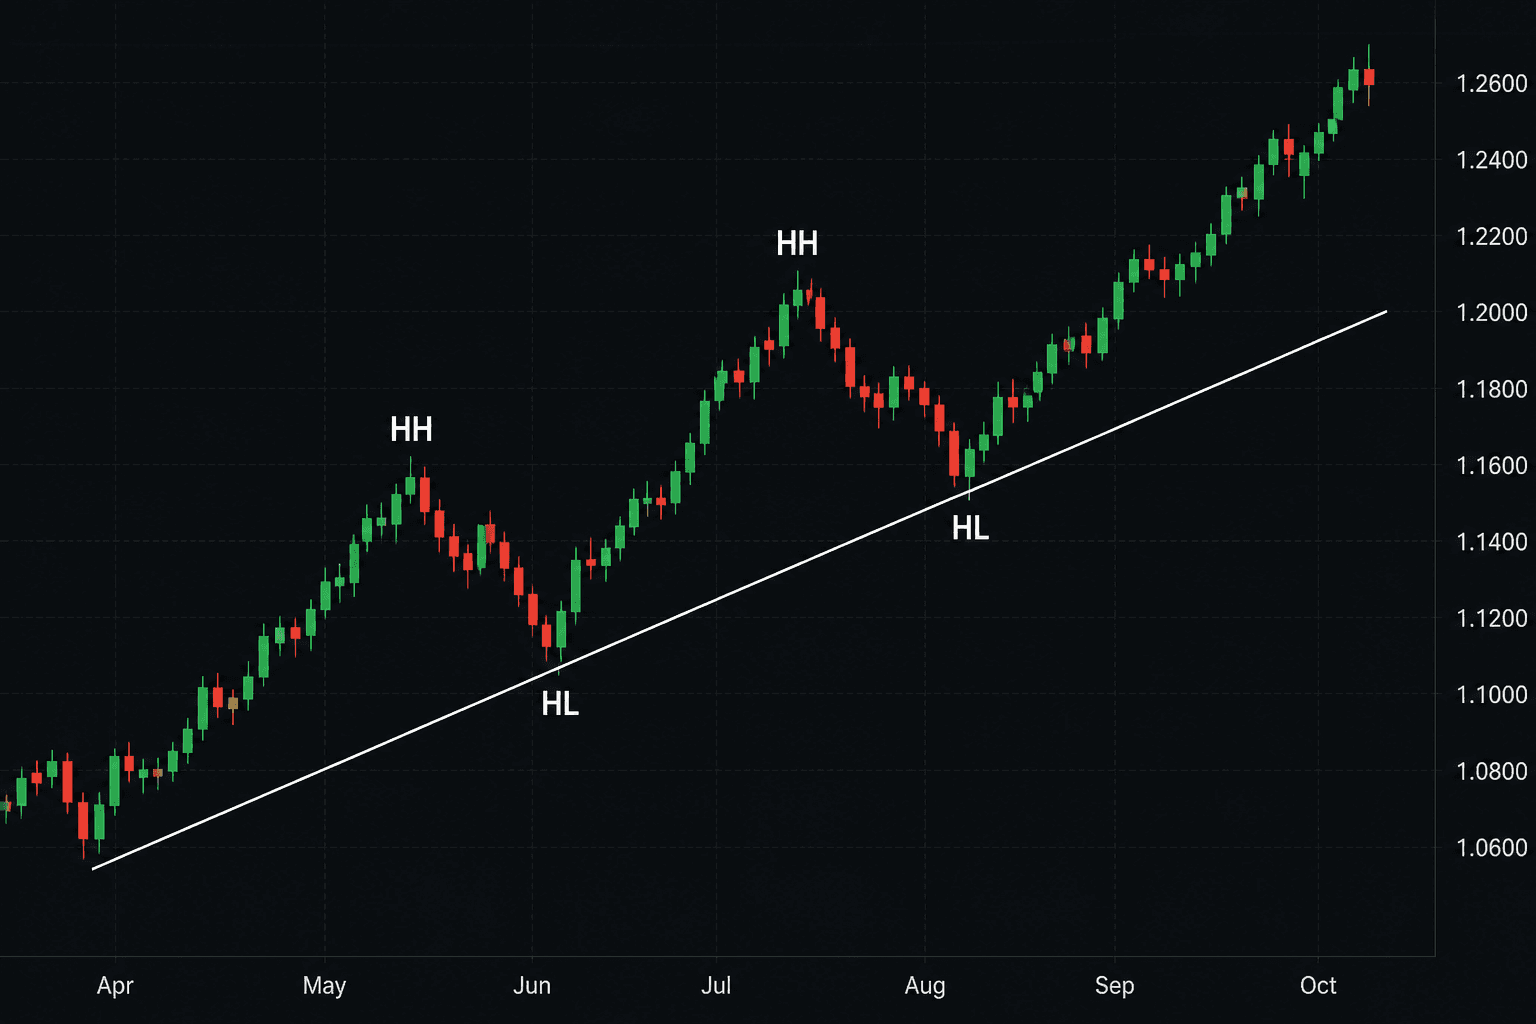
An uptrend is a series of higher highs and higher lows. A downtrend is the opposite. As long as the series keeps its shape, the trend is alive. The first genuine break of that series is the first warning that something is changing.
On the picture marked HH and HL: that is the simplest structure read. You do not need a trend indicator. If price breaks the last HL and closes below it, the uptrend is in doubt. A lot of people wait for an indicator to scream while the chart already spoke two candles ago.
The old saying that the trend is your friend survives for a simple reason: trading with the trend gives you a bigger margin for error. Your entry can be imperfect and the trade can still work because the current is with you. Counter-trend trading demands precision and timing. Not a beginner's battle.
And there is a third state people forget: the sideways market. Highs and lows around the same places. Trend-following dies there, and range tactics (buy the low, sell the high) get smarter. First question before any trade: up, down, or stuck?
Leverage, lots and pips
Leverage is not free profit. It is a small loan from the broker that lets you move a bigger position than your cash. If your account is $500 and you open a trade that needed $5,000 of margin, leverage is what allowed it. Gains get bigger. Losses do too.
A pip is the usual unit of a price step. On most forex pairs it is the fourth decimal (EURUSD from 1.0850 to 1.0851 is one pip). Gold and yen pairs count a bit differently, so learn the pip value of the instrument you actually trade before you hit buy.
Position size: a standard lot is 100,000 units, mini is 10,000, nano is 1,000. The bigger the lot, the more each pip is worth in money. A beginner on a small account starts mini or nano. The person who opens a full lot in week one often does not see week four.
Risk management
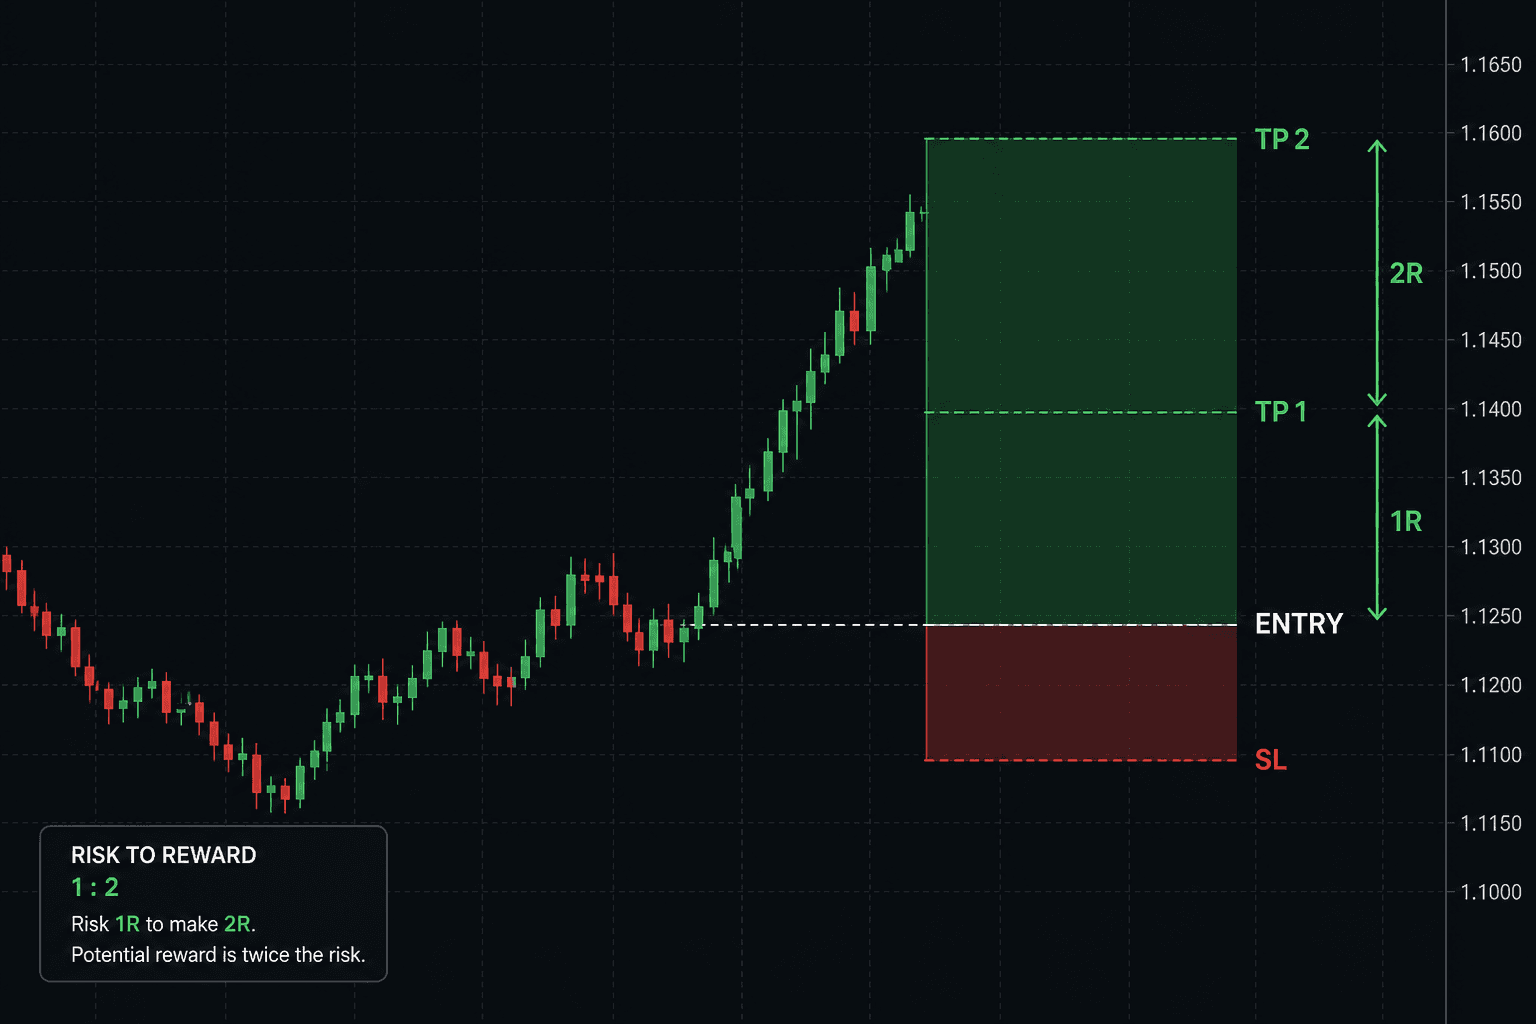
Read this section twice, because it's the real difference between traders who last and accounts that blow up in the first month. No analysis in the world helps you if one bad trade can erase two weeks of work.
The golden rule: never risk more than 1-2% of your capital on a single trade. If your account is $1,000, your maximum acceptable loss per trade is $10-20. That way you can be wrong ten times in a row and still be standing. And trust us, you will be wrong.
On the picture: entry on the line, stop under the red zone, targets above. The distance to target is roughly twice the distance to the stop. Lose once and win once at the same size, and you are still ahead. If you take wide stops and tiny targets, even a 60% win rate can bleed you slowly.
And a stop loss is not optional. A trade without a stop is a ticking bomb, and everyone who has tried watching it and closing by hand knows how that story ends. Decide where your idea is clearly wrong before you enter, put the stop there, done.
Position size comes from the stop, not from your mood. If the stop is 40 pips away and 2% of the account is $20, you pick a lot size that loses $20 if those 40 pips go against you. Not the other way around: opening huge, then discovering the stop eats the account.
- 1-2% maximum risk per trade
- A stop loss on every trade, no exceptions
- A reward-to-risk ratio of at least 2:1
- Never chase losses by doubling size. That's the fastest road to zero
Mistakes we see every day
We collected the mistakes we see most with beginners. Not from a textbook, from real messages we receive and from our own early mistakes:
- Using high leverage in week one. Leverage magnifies losses before it magnifies gains
- Revenge trading: losing a trade, then instantly opening two more with no analysis
- Switching strategies every week because there is a better one. Consistency with one approach matters more than the approach itself
- Trading money you can't afford to lose. Psychological pressure ruins the best plan
- Skipping the demo account and jumping straight to a live one
- Trading through high-impact news without even knowing there was news
- Dragging the stop further away to give it room. That is no longer risk management, that is pride