
ORYXAORYXA

Trading Schools

There's no "best" school and "worst" school. There's the school that fits your personality, your time, and the way you think. We've gathered the most well-known schools here with an honest summary of each: the idea behind it, its key concepts, and who it suits. Read about all of them, then pick one and go deep instead of hopping between them.

Classic Technical Analysis

Where most traders around the world start
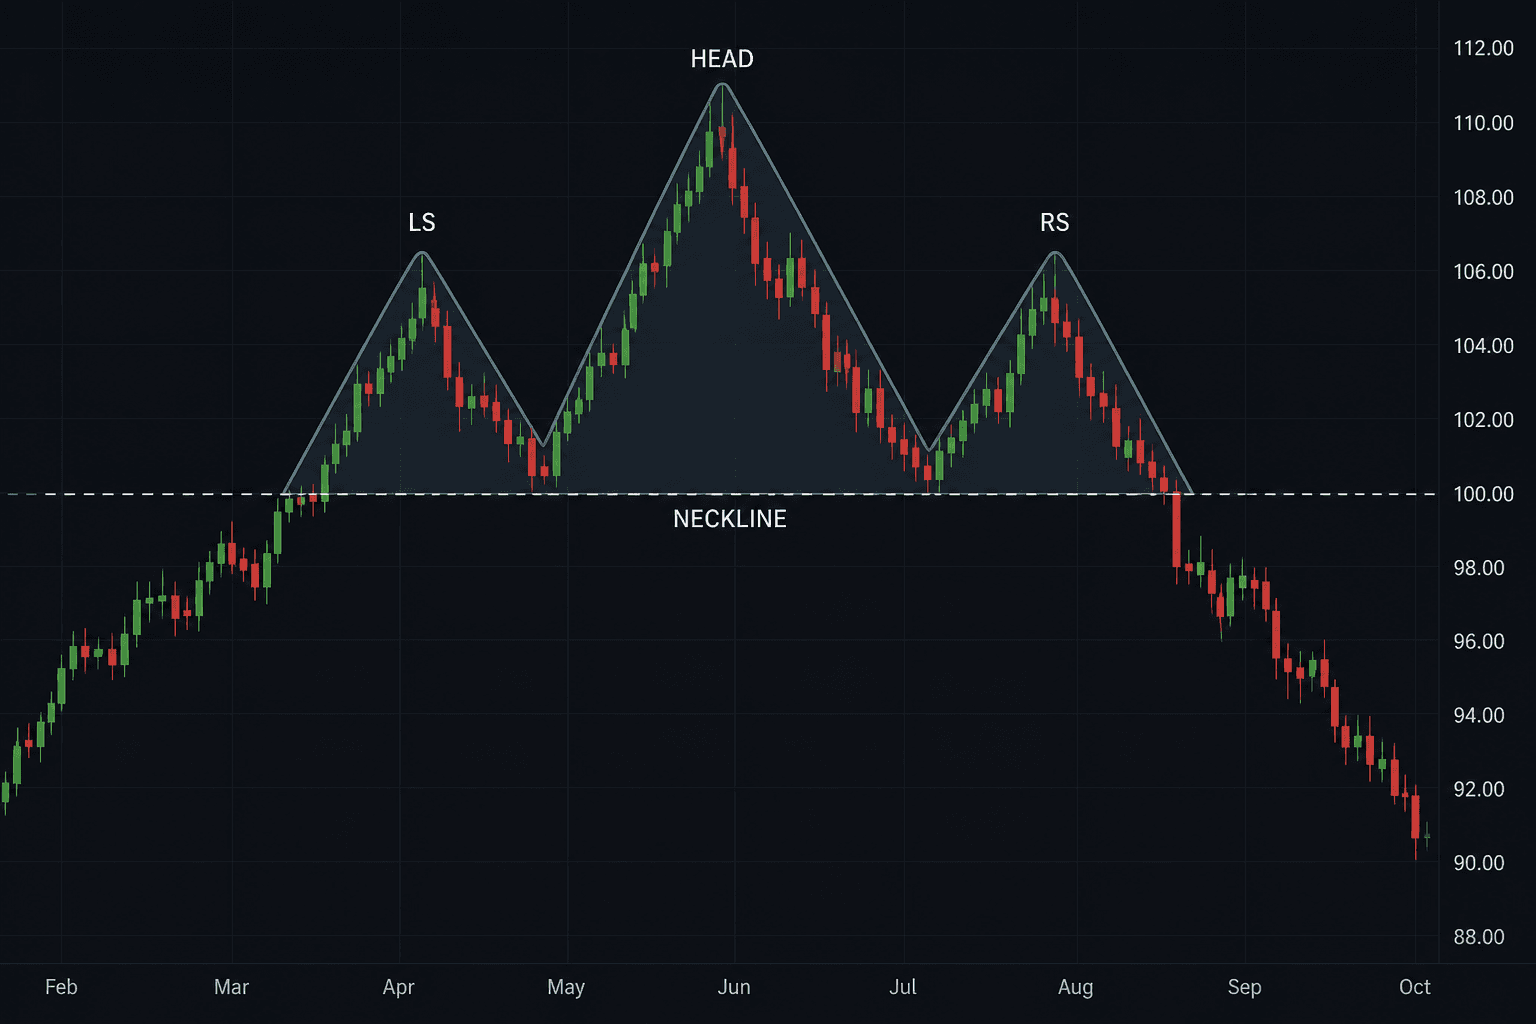
Head and shoulders pattern on a candlestick chart, with neckline and breakdown
Head and shoulders is one of the classic patterns: left shoulder, higher head, right shoulder, then a break of the neckline.

This is the mother school. Open almost any technical analysis book and it starts here. The idea is simple: price moves in patterns that repeat, and if you learn to read those patterns you can build a reasonable expectation for the next move.

It relies on support and resistance, trendlines, and the well-known chart patterns like head and shoulders, double tops and bottoms, and triangles. Indicators like moving averages, RSI and MACD are used as helpers, not as the basis of the decision.

Take the head and shoulders in the picture. Price makes a peak (left shoulder), a higher peak (the head), then a lower peak (right shoulder). The line connecting the lows between those peaks is the neckline. When the neckline breaks with momentum, a classic trader reads that as the uptrend being done, and often measures the distance from the head to the neckline as a rough downside target.

The same logic flips for a double bottom or an inverse head and shoulders. You are not memorizing a drawing. You are reading a story: buyers failed to print a new high, so strength is fading.

From our experience, the biggest beginner mistake here is loading twenty indicators on the chart and waiting for a magic signal. Good classic analysis means understanding why price stopped at a certain area, not chasing colored arrows on the screen. RSI is useful when it lines up with a clear resistance, not when it fires alone in the middle of nowhere.

Key concepts

  • Support and resistance
  • Trendlines and channels
  • Chart patterns (head and shoulders, double tops and bottoms, triangles)
  • Indicators as supporting tools

Who is it for?

Right for anyone starting out. A foundation you should pass through before moving to any other school.
Open the dedicated page

Price Action

The clean chart: price, candles, nothing else

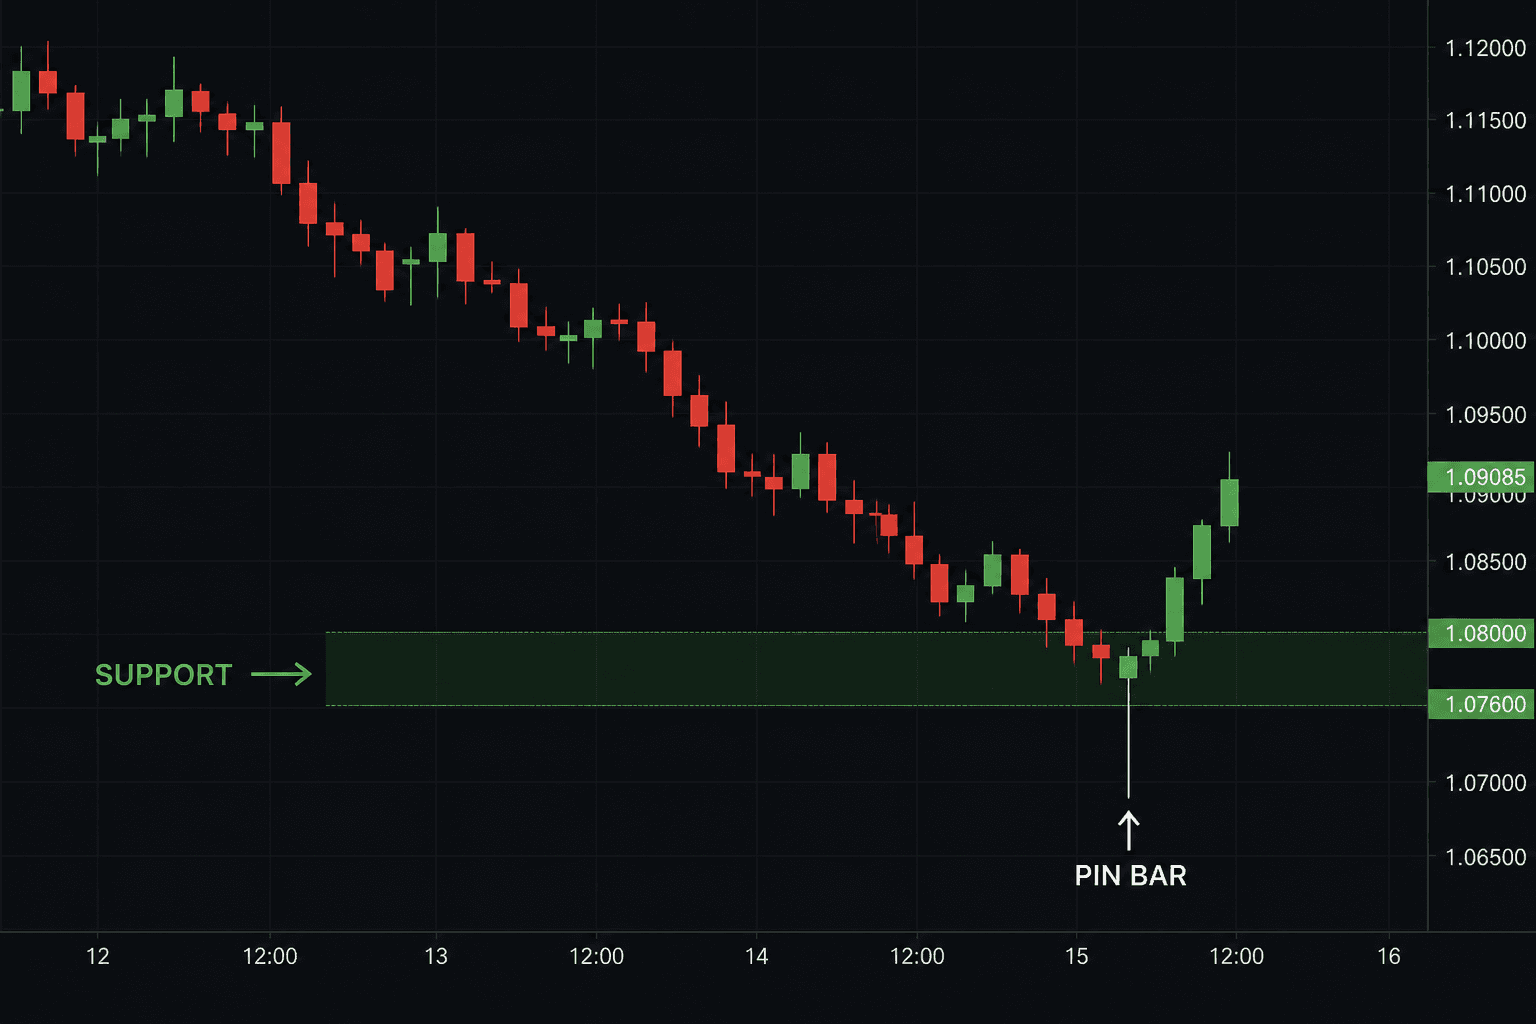
A pin bar at a support zone after a decline, followed by a bounce
A pin bar at support. The long lower wick means sellers tried to break the zone and got rejected.

Price action is simply reading the movement of price itself, with no indicators. Every candle tells a story: who was in control during the session, where sellers stepped in, where buyers gave up. Put those stories together at important levels and you get a clear picture of the market.

Traders here focus on reversal candles like engulfing patterns and pin bars, and on how price behaves at support and resistance: did it break through with strength? Come back to retest? Or fake the breakout and trap people?

The picture above is a working example. Price is falling, it reaches a support zone that already bounced once, and prints a pin bar with a long lower wick. The story: sellers pushed, the market dipped under support, then buyers yanked it back and closed near the top of the candle. A common entry is after that close, stop under the wick, target the next clear resistance.

The detail that separates real work from shape-memorizing: the same pin bar in the middle of nowhere, with no level and no trend, is worth almost nothing. Context gives the candle its meaning.

The good part is that it makes you genuinely understand the market instead of memorizing rules. But it takes patience and screen time. You will not master it from one YouTube video. It needs months of watching, demo practice, and notes on where your reading worked and where a fake break fooled you.

Key concepts

  • Reversal candles (engulfing, pin bar, doji)
  • Real breakouts vs fake breakouts
  • Retests of key levels
  • Market structure: highs and lows

Who is it for?

For people who like simplicity and are willing to put in the screen time to learn by doing.

Open the dedicated page

Smart Money Concepts (SMC)

Think like institutions, not like the crowd

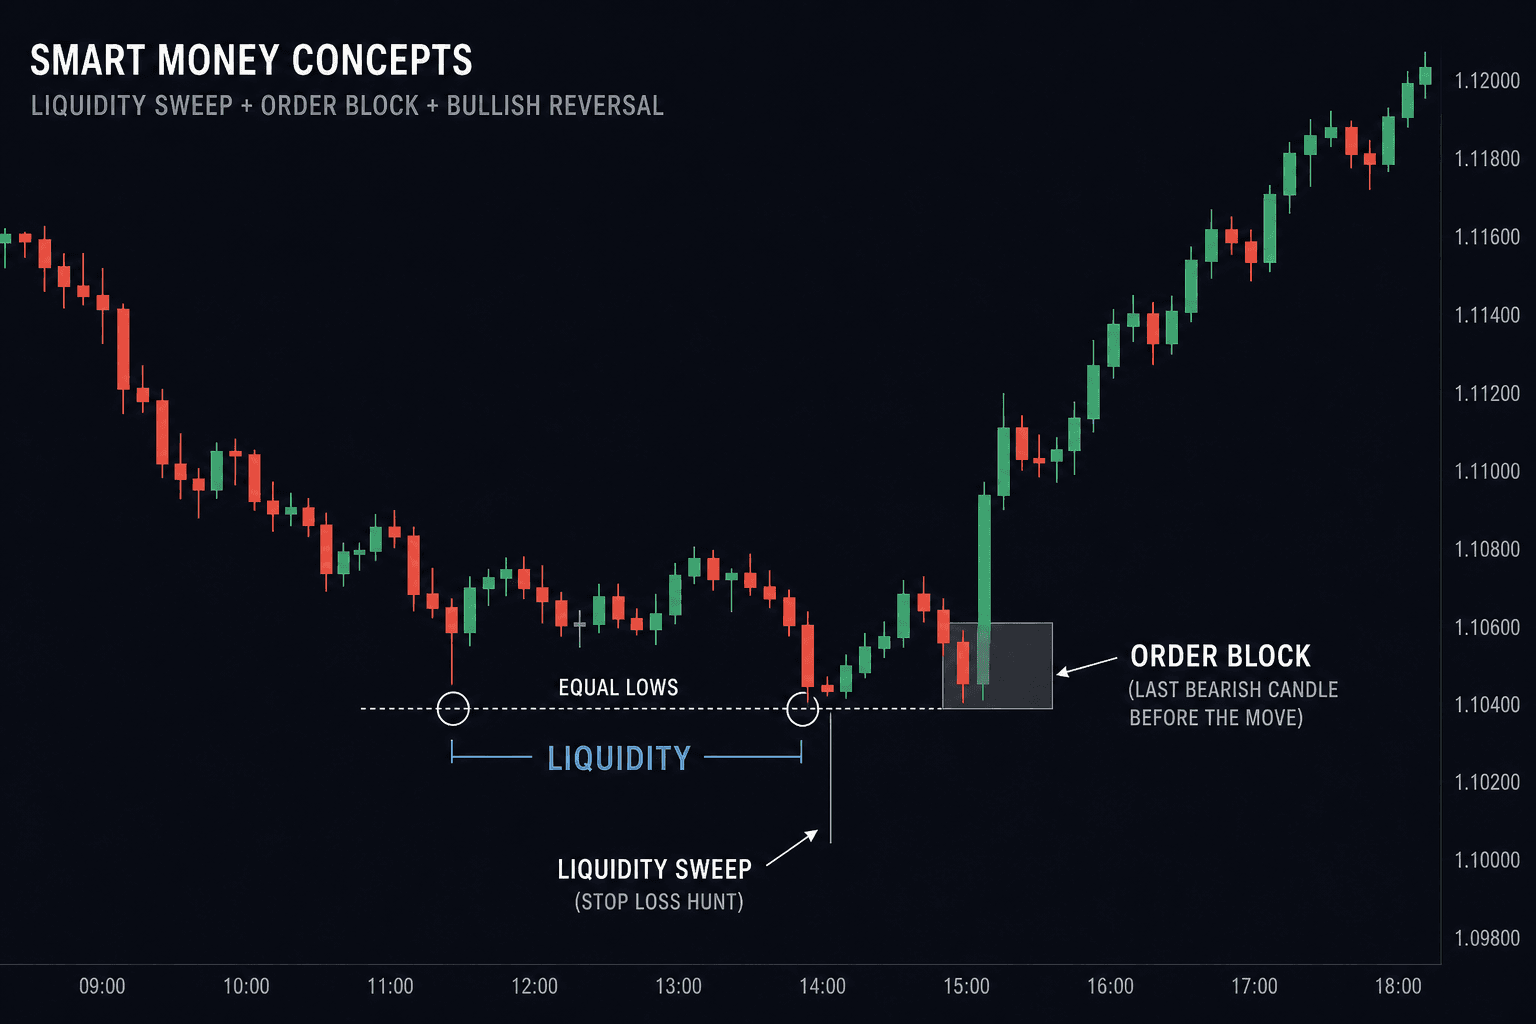
Chart showing a liquidity sweep under equal lows, then a bounce from an order block
Equal lows (liquidity), a wick sweeping under them, then a reversal. Stops sitting under those lows got taken before the real move.

The school that exploded in popularity in recent years. Its core idea is that the market does not move randomly. Banks and large institutions (the smart money) move it, and the retail trader's job is to read their footprints and follow, instead of standing in their way.

It works with concepts like liquidity pools (where everyone's stop losses cluster), order blocks (the last accumulation zone before a strong move), and fair value gaps. The idea is that price returns to these areas to collect liquidity before continuing in the real direction.

The picture sums up a scene we see a lot: the market prints equal lows, people park stops under them because the textbook said so. Then a long wick dips under those lows, grabs the stops, and rips back up. The person who shorted the break got hurt. The person who waited for the sweep and the reclaim read the game.

An order block is not a magic rectangle either. It is usually the last opposing candle before the impulsive move. Price often comes back to tap it as a supply or demand area, and that is when you look for confirmation: a rejection candle, a filled gap, a shift in structure.

Let's be honest: some people have turned this into a religion and talk about it like a sacred secret. At the end of the day it is an organized way to read market structure and liquidity. Genuinely powerful once you get it right, but not a magic wand and never a substitute for money management. If you have no stop, SMC will not save you.

Key concepts

  • Liquidity and stop-loss clusters
  • Order blocks
  • Fair value gaps (FVG)
  • Break of structure (BOS) and change of character (CHoCH)

Who is it for?

For traders who are past the basics and want to understand what happens behind the scenes of a price move.

Open the dedicated page

ICT (Inner Circle Trader)

Timing before everything

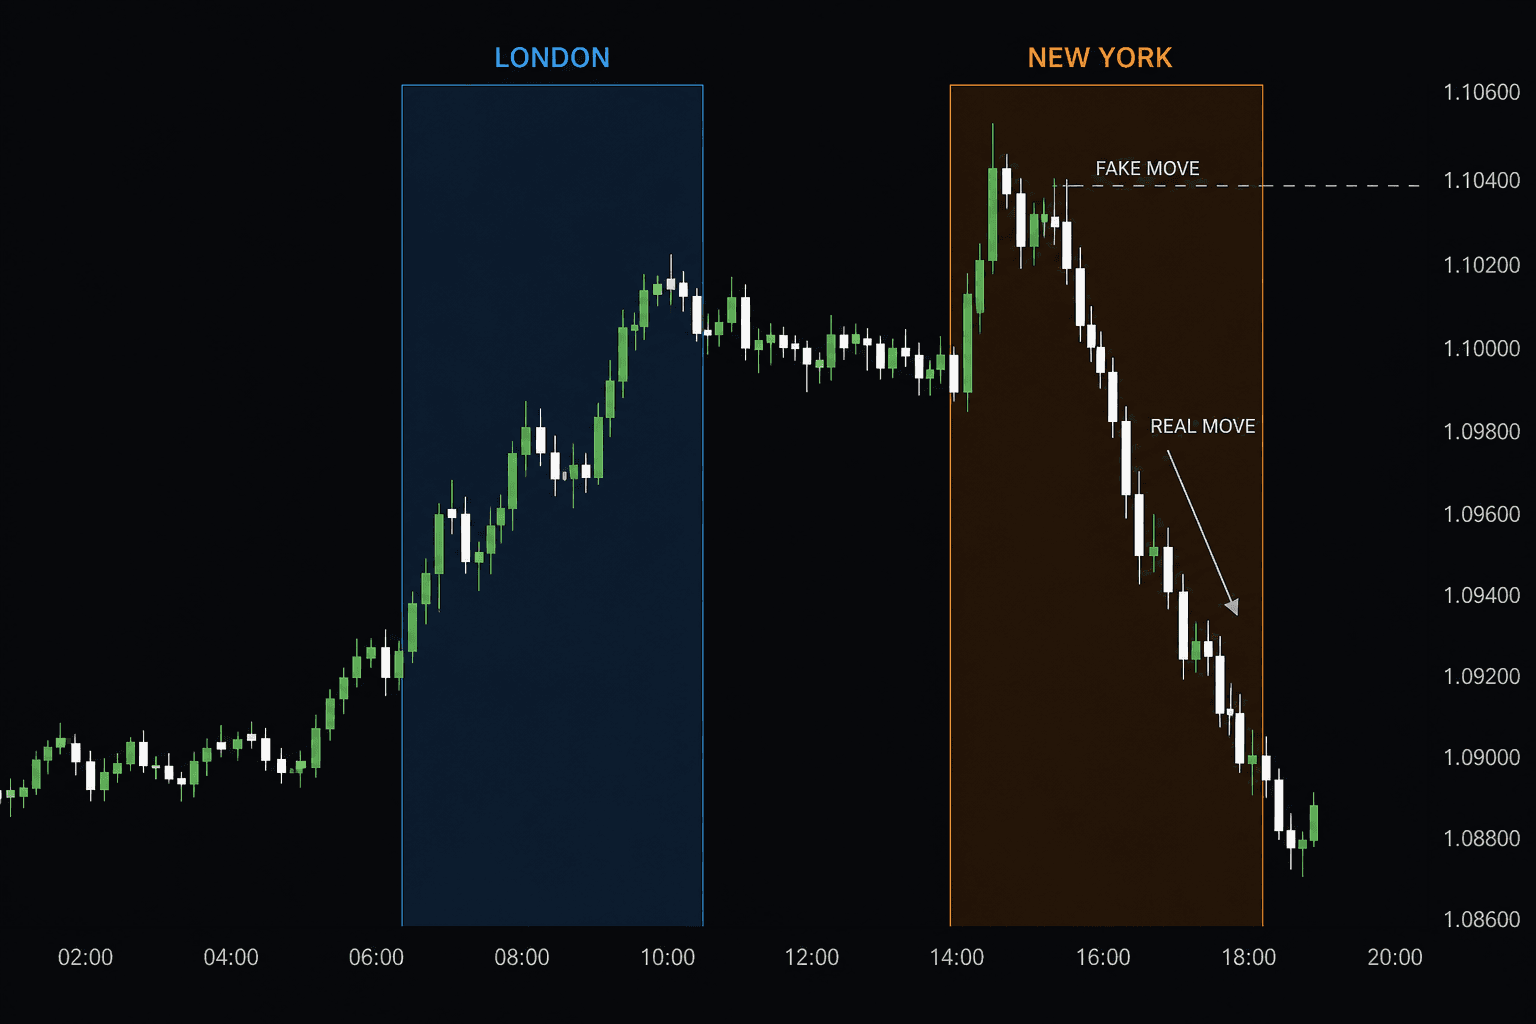
Intraday chart with London and New York session windows highlighted
Two important windows: London and New York. Most of the real movement happens inside these sessions, not all day.

ICT is Michael Huddleston's methodology, and it is actually what most SMC concepts were built on. The difference is that it goes deeper and adds a crucial element: time. Not just where price will move, but when.

It works with trading sessions (London and New York), specific windows of the day called killzones where institutional moves happen, and concepts like the Judas Swing: the deceptive move at the start of a session designed to trap people before the real move.

From the picture: the market is quiet before London, then liquidity comes in at the London open, and into New York you sometimes get a move against the true daily direction first (the trap), then the real trend of the day shows itself. The trader who is glued to the screen from morning to evening, with no idea which session they are in, is fighting the market in dead hours.

There is also a daily shape that repeats a lot: Asian range, expansion that breaks the range, then a partial retrace into the midpoint or the broken edge. You do not have to worship the name. You do have to start seeing the day as a structure, not as a pile of random candles.

It is a huge methodology with a lot of terminology, and the original content runs hundreds of hours. Our advice if you want in: take one concept, test it on the chart for weeks, then move to the next. People who try to swallow everything at once get lost, and a month later they hate the whole method.

Key concepts

  • Trading sessions and killzones
  • The Judas Swing
  • Internal vs external liquidity
  • The daily price delivery model (Power of 3)

Who is it for?

For the serious trader with time and commitment. This is not something you learn in a weekend.

Open the dedicated page

Elliott Wave Theory

Markets move in waves, if you can count them

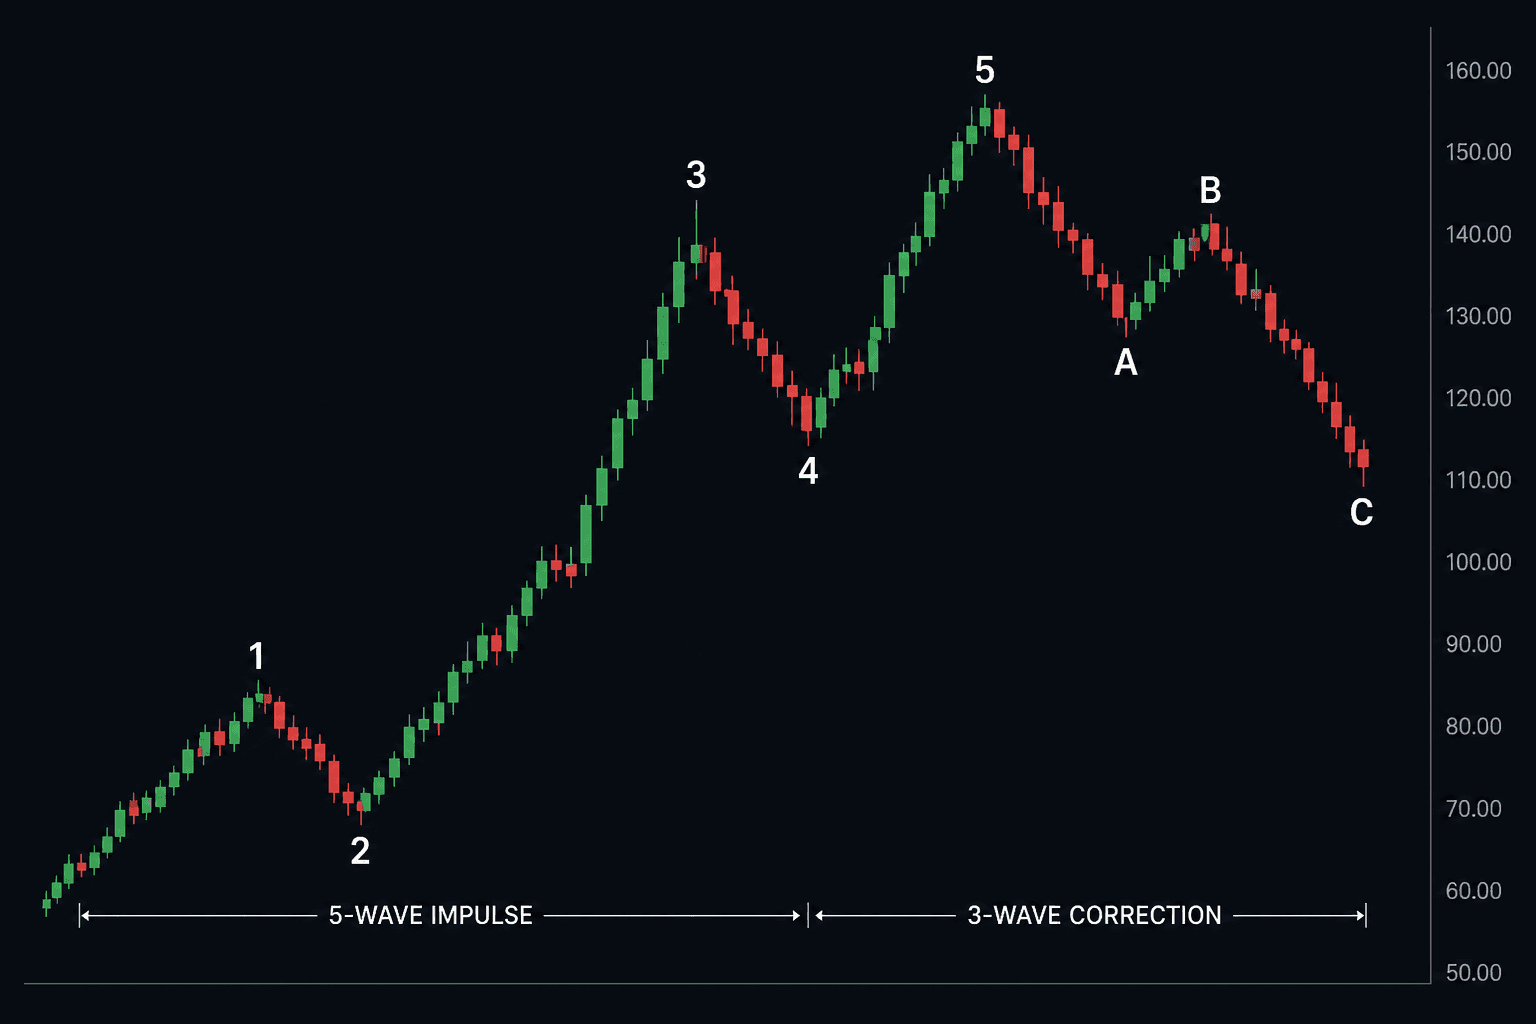
Elliott wave count: five impulse waves up, then a three-wave correction
The basic count: 1-2-3-4-5 with the trend, then A-B-C against it. Wave 3 is often the strongest.

An old theory from the 1930s. It says crowd psychology moves markets in a repeating pattern: five waves with the trend, three corrective waves against it. And every big wave subdivides into smaller waves of the same shape.

Its strength is that it gives you a full map of the market: where we are in the cycle and what's expected next. It also pairs nicely with Fibonacci ratios for wave targets and correction zones.

On the picture, wave 1 starts the move, wave 2 is a pullback that should not break the start of 1, wave 3 is the strongest stretch (this is where beginners usually arrive late because they wanted extra confirmation), wave 4 is a quieter pause, wave 5 is the last push before fatigue. Then A-B-C starts eating profits if you insist on buying the high.

Some things are rules, not vibes: wave 2 does not break the origin of wave 1, wave 3 is not the shortest of 1-3-5, and wave 4 usually does not dive deep into wave 1 territory. If a rule breaks, the count is wrong. You adjust. You do not force the chart to flatter your count.

Its famous weakness is the count itself. Ten analysts can count the same chart ten different ways. That is why we recommend using it as one tool within your system, not the whole system. When a wave count lines up with strong support and a reversal pattern, that is when the picture gets convincing.

Key concepts

  • Five impulse waves and three corrective waves
  • Rules and guidelines of wave counting
  • Fibonacci ratios for targets and retracements
  • Wave nesting across timeframes

Who is it for?

For people who enjoy deep analysis and a big-picture view of the market, with patience for detail.

Open the dedicated page

The Wyckoff Method

What is the big player doing before the move?

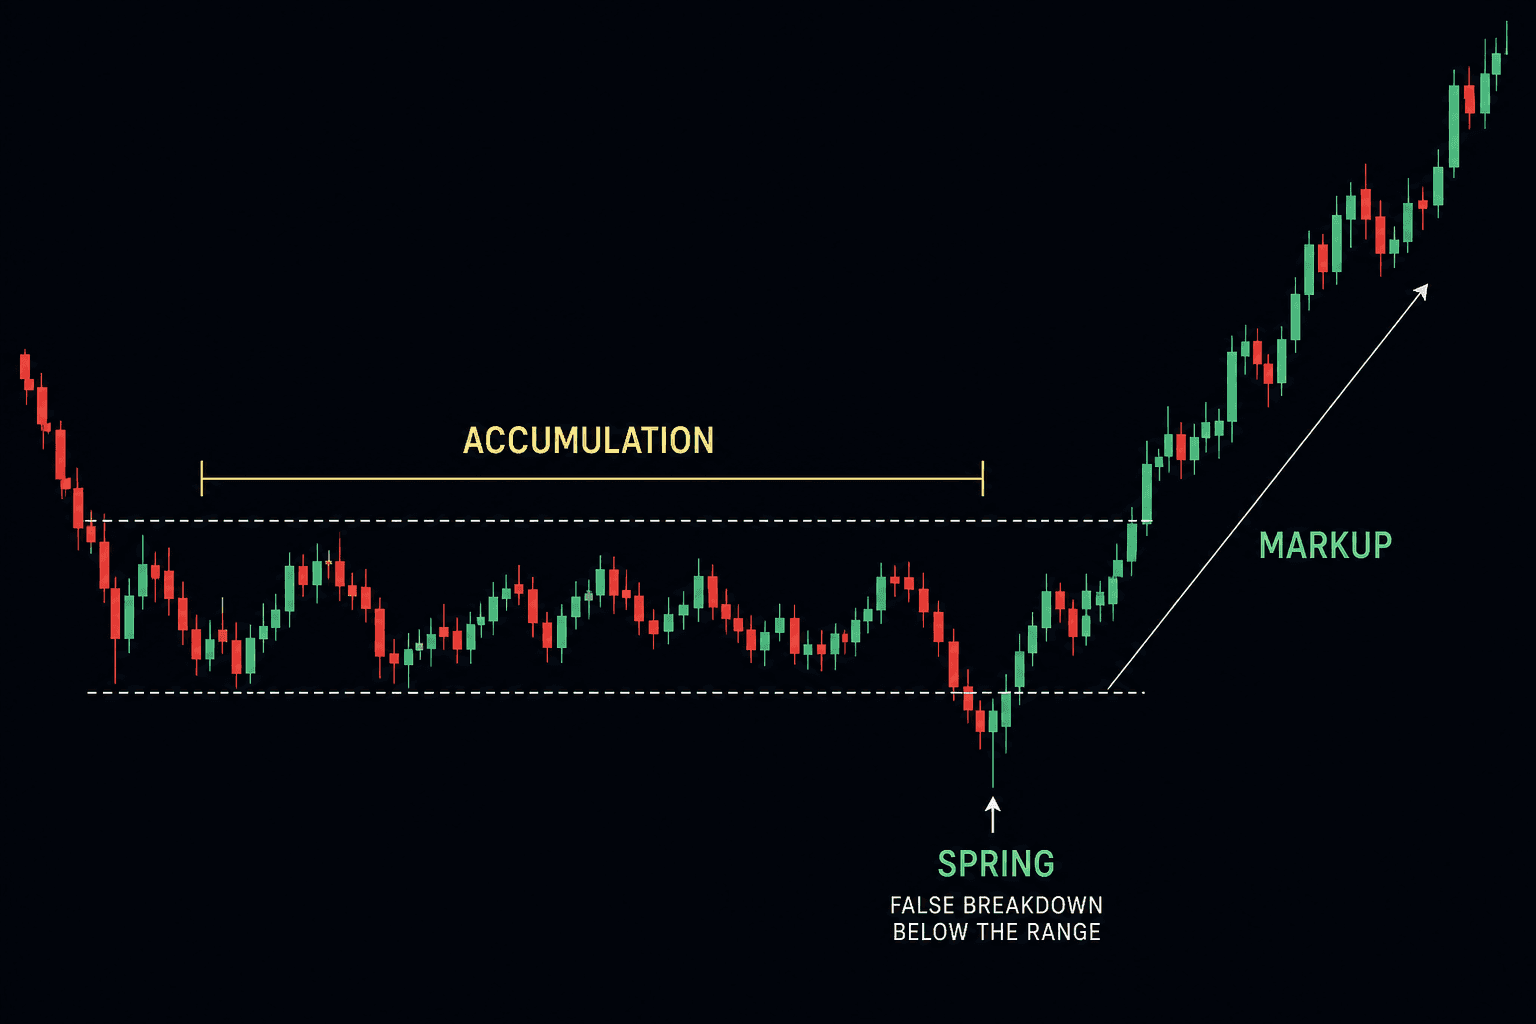
Wyckoff accumulation range with a spring fake breakdown, then markup
Accumulation, a fake breakdown under the range (the Spring), then markup. Sellers got trapped underneath, buyers were ready.

Richard Wyckoff was one of the first to talk about the Composite Man: imagining the whole market as one big player who quietly accumulates, then marks price up, or quietly distributes, then marks it down. Every modern smart-money concept has its roots here.

The method divides market movement into phases: accumulation, markup, distribution, markdown. Inside the accumulation and distribution ranges there are known events like the Spring: the fake break below support that traps sellers right before the launch.

You can read the phase on the picture. Price is stuck in a range, people get bored, then a break under the range grabs stops (the Spring), then it snaps back inside quickly. That reclaim is the tell that the break was a trap, not a new downtrend. The people who sold the break become fuel for the rally.

Its biggest addition compared to other schools is volume. The relationship between price movement and traded volume is the heart of the method. A strong move on weak volume is a warning sign. A breakout on huge volume means something completely different. Retail forex volume is not as clean as stocks, so Wyckoff shines more on stocks and crypto, but the phase idea still helps in any market.

If you want it practical: decide if the market is ranging or trending. If it is ranging, ask whether accumulation is happening below or distribution above. Do not buy every break. Wait for the snap-back into the range after the sweep. That one sentence will save you a lot of dumb trades.

Key concepts

  • The four market phases (accumulation, markup, distribution, markdown)
  • The Composite Man
  • Springs and upthrusts
  • Price and volume relationship analysis

Who is it for?

For those who want to understand market logic from its roots, especially stock and crypto traders, where volume data is real.

Open the dedicated page

Harmonic Patterns

Fibonacci geometry on the chart

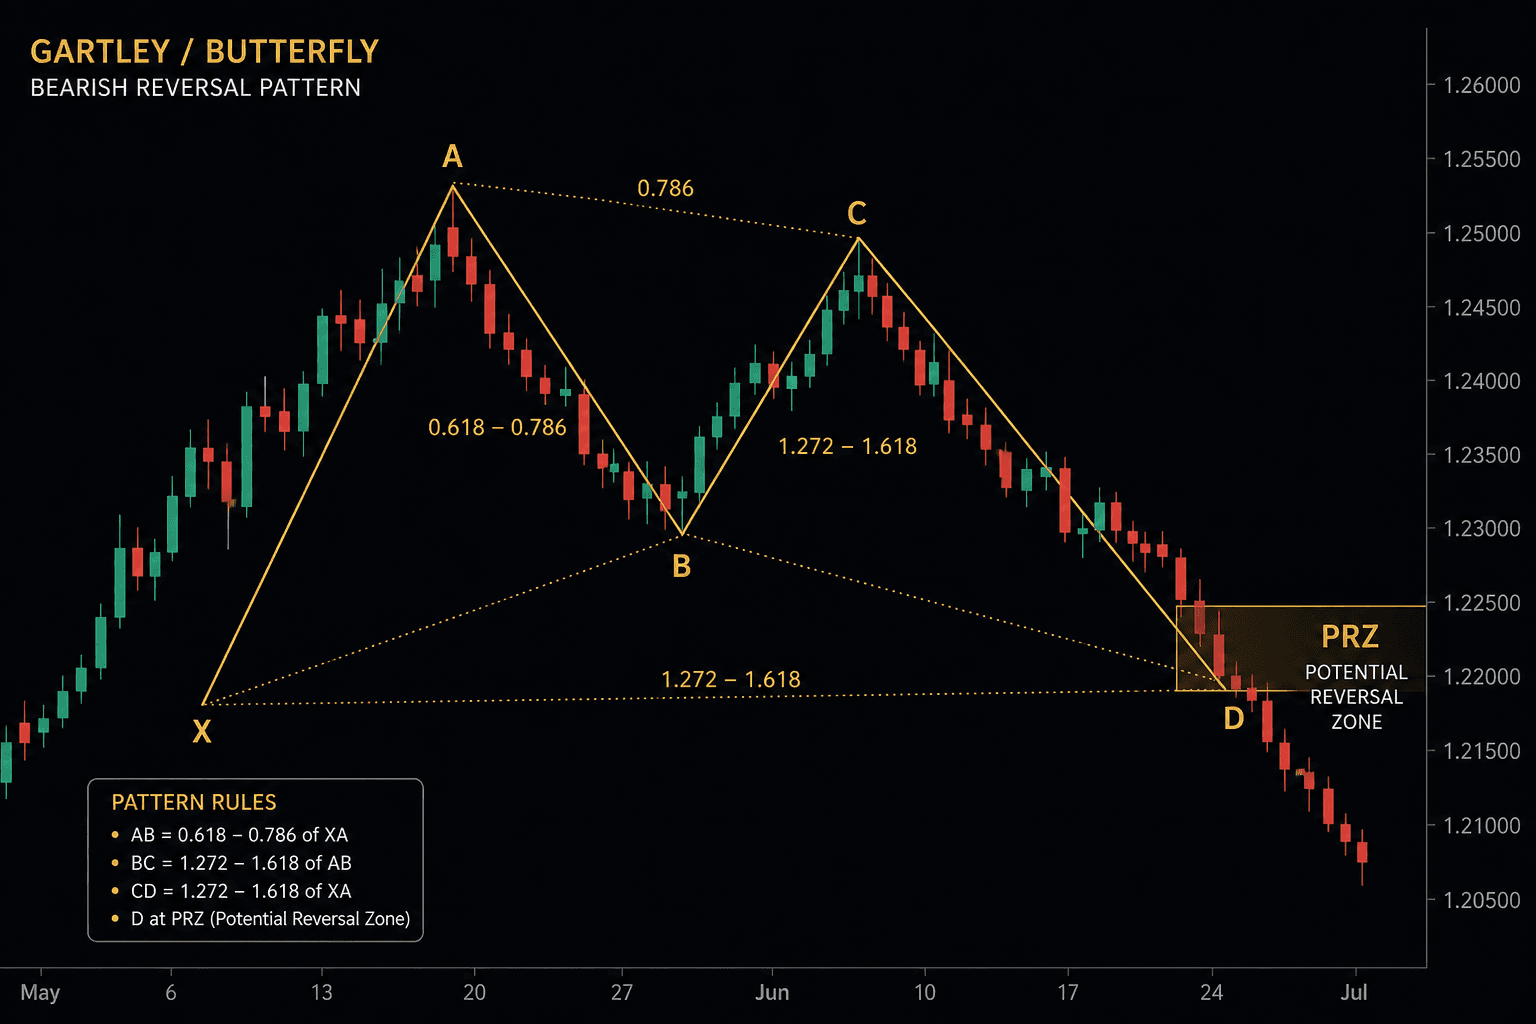
A completed harmonic pattern landing in a potential reversal zone
Points X-A-B-C-D. When D lands on the required Fibonacci ratios, you get the potential reversal zone.

A school built on precise geometric price patterns based on Fibonacci ratios. The patterns have animal names and odd labels (the Butterfly, the Bat, the Crab, the Gartley), and each one has specific ratios that must be met for it to be valid.

The idea: when a pattern completes at the right ratios, it forms a potential reversal zone where you can enter with a tight stop and a clear target. That makes it one of the more disciplined schools in terms of pre-defined entries and exits.

A simple walkthrough: price runs from X to A, retraces to B (often 61.8% of XA in a Gartley), continues to C, then D lands in a zone defined by XA and BC ratios. If D sits inside that box, the trader waits for reversal behavior inside the box. They do not jump early because the shape looked cute.

The nice part is that the stop is obvious: beyond X or beyond the far edge of D. Risk to reward is often decent if you wait for completion instead of guessing halfway.

But be careful: not every zigzag on the chart is a Bat. Respecting the ratios is a requirement, and a pattern without context (trend, key level) is worth little. There are tools that auto-draw these patterns, but blindly trusting them is a recipe for losses. Use the drawing as a filter, and the close plus price behavior as the decision.

Key concepts

  • Exact Fibonacci ratios per pattern
  • Gartley, Butterfly, Bat and Crab patterns
  • The potential reversal zone (PRZ)
  • Pre-defined risk-to-reward setups

Who is it for?

For people who love precision and clear rules, and don't mind waiting for a pattern to complete.

Open the dedicated page

Fundamental Analysis

News and economics: the other side of the market

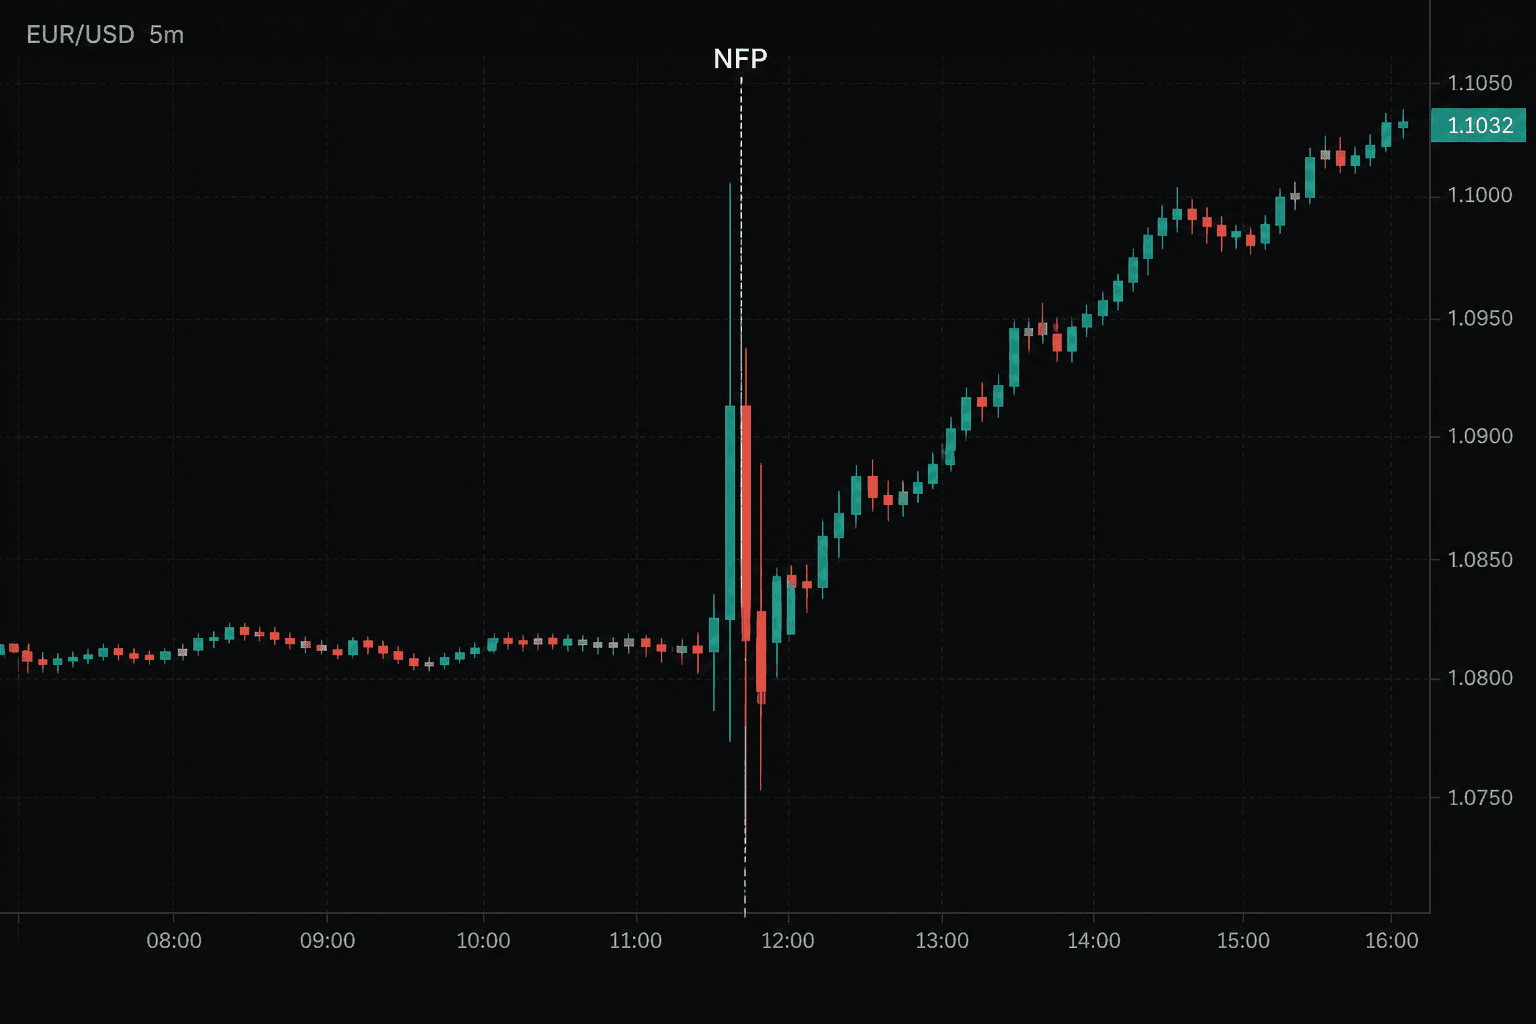
Chart showing a violent spike around a high-impact economic release
Around events like NFP or rate decisions, spreads widen and wicks print both ways. Not the time to test a new strategy.

Every school above reads the chart. This one reads what's behind the chart: central bank decisions, interest rates, inflation, jobs data, and geopolitical events. These are the things that create the big trends that run for months.

We're not saying you need to become an economist, but there's a minimum you can't ignore: you must know when high-impact news is due (like US non-farm payrolls or rate decisions), because the market moves violently at those times and takes out stops in both directions.

The picture is a typical news print. Before the release the market sometimes coils, then the number hits and you get a gap or a huge wick, and some brokers widen the spread. Even if your technical idea was right, execution in that minute can stop you out far from the level you drew. That is why a lot of people flatten or cut size before the event, then come back after the dust settles.

Fundamentals also help on the bigger frame. If the Fed is hiking and the dollar is strong, buying every dip in gold with no context can grind you for months. That does not mean you never fade a headline. It means you know you are swimming against a current.

The best approach we've seen for an individual trader: technicals for entries and exits, fundamentals as a backdrop and a filter. Know why the market is heading somewhere, and stay out during dangerous news if your style can't handle it.

Key concepts

  • Interest rates and central bank decisions
  • Inflation and employment data
  • The economic calendar and news timing
  • Inter-market relationships (dollar, gold, oil)

Who is it for?

A minimum requirement for everyone, and essential for medium and long-term traders.

Open the dedicated page

One last piece of advice: any of these schools works if you commit to it and apply it with discipline and proper money management. The problem is never the school. It's jumping between them every time you watch a new video.

Trading schools: classic, price action, and SMC | ORYXA