

Price Action
The clean chart: price, candles, nothing else
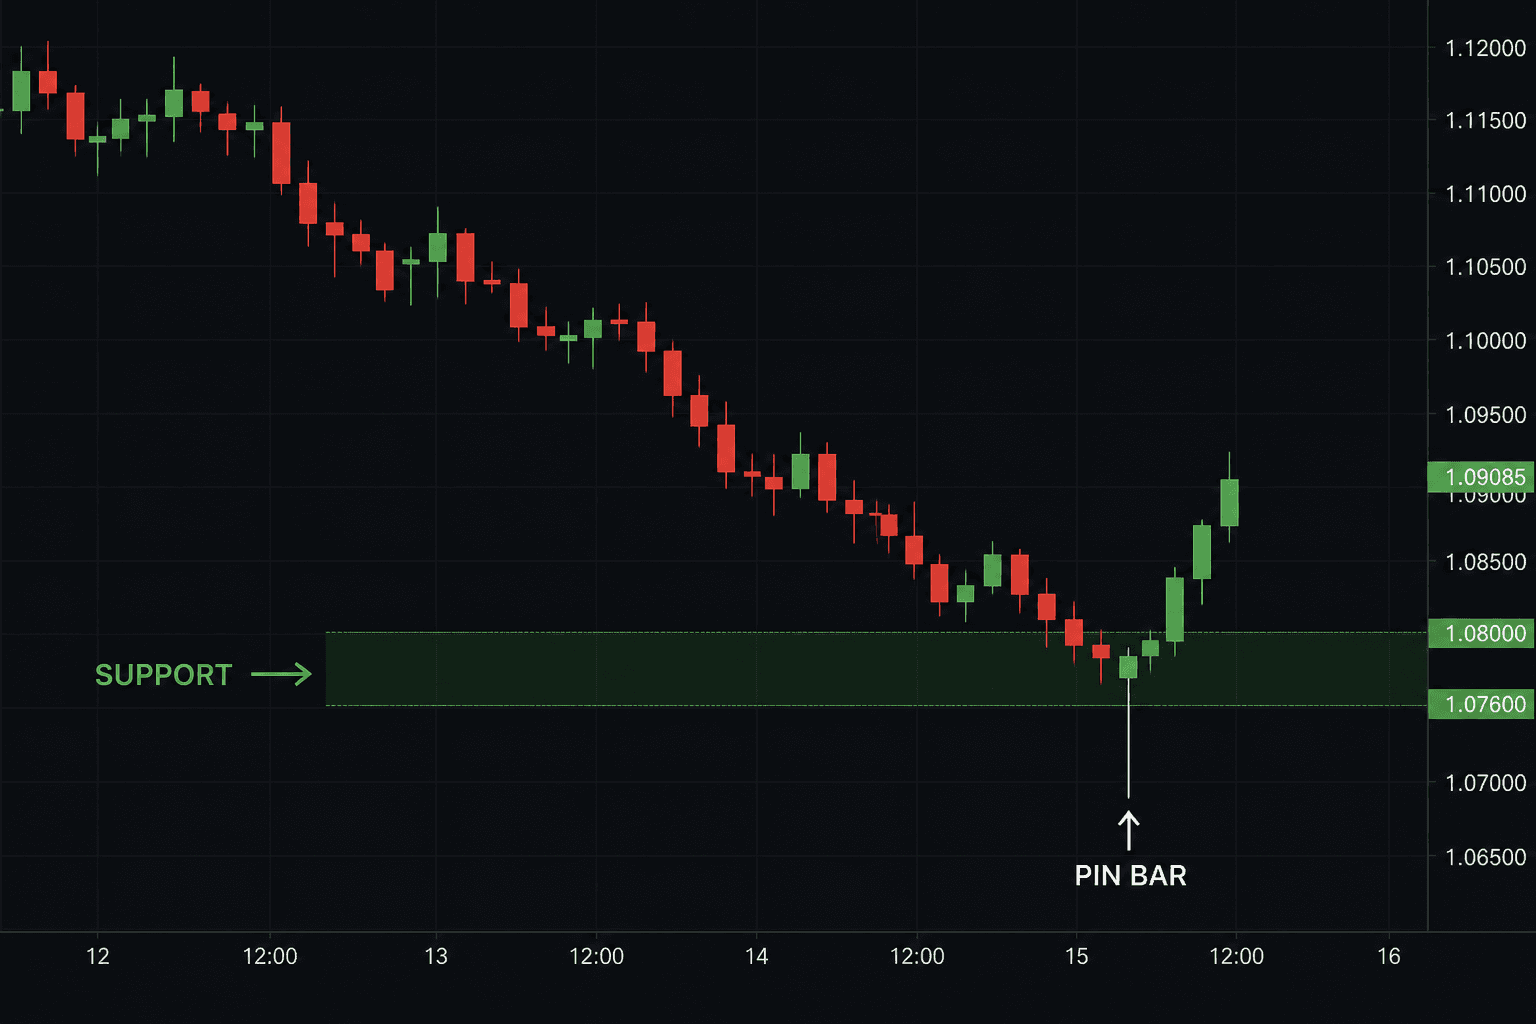
Price action is simply reading the movement of price itself, with no indicators. Every candle tells a story: who was in control during the session, where sellers stepped in, where buyers gave up. Put those stories together at important levels and you get a clear picture of the market.
Traders here focus on reversal candles like engulfing patterns and pin bars, and on how price behaves at support and resistance: did it break through with strength? Come back to retest? Or fake the breakout and trap people?
The picture above is a working example. Price is falling, it reaches a support zone that already bounced once, and prints a pin bar with a long lower wick. The story: sellers pushed, the market dipped under support, then buyers yanked it back and closed near the top of the candle. A common entry is after that close, stop under the wick, target the next clear resistance.
The detail that separates real work from shape-memorizing: the same pin bar in the middle of nowhere, with no level and no trend, is worth almost nothing. Context gives the candle its meaning.
The good part is that it makes you genuinely understand the market instead of memorizing rules. But it takes patience and screen time. You will not master it from one YouTube video. It needs months of watching, demo practice, and notes on where your reading worked and where a fake break fooled you.
Key concepts
- Reversal candles (engulfing, pin bar, doji)
- Real breakouts vs fake breakouts
- Retests of key levels
- Market structure: highs and lows
Who is it for?
For people who like simplicity and are willing to put in the screen time to learn by doing.