

Harmonic Patterns
Fibonacci geometry on the chart
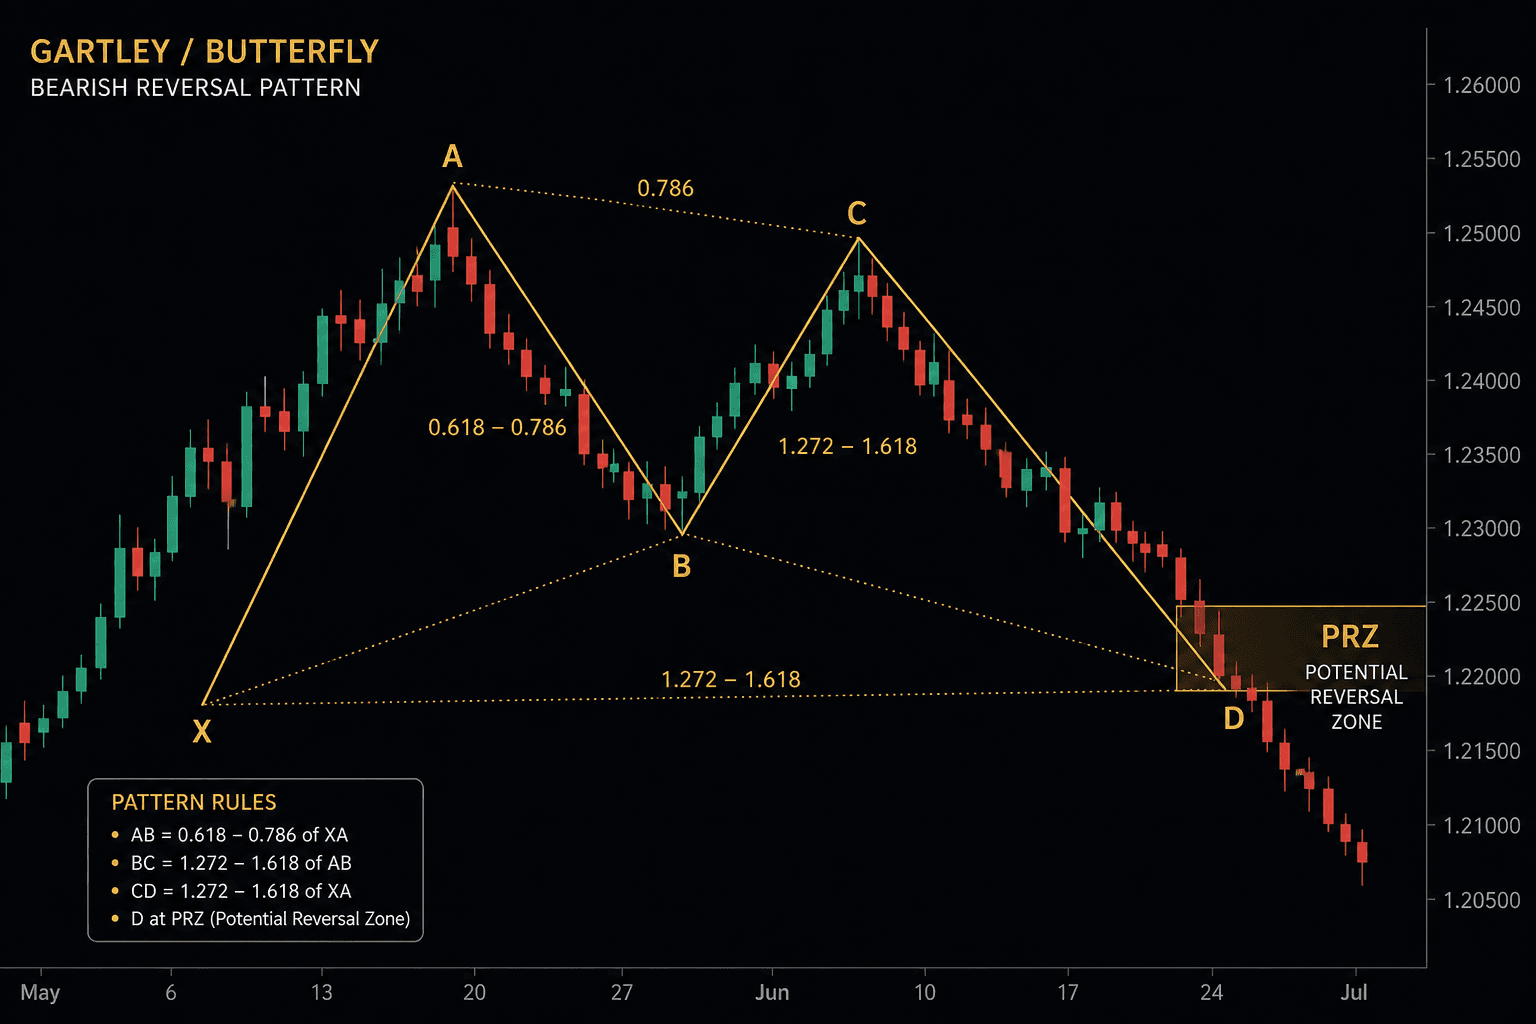
A school built on precise geometric price patterns based on Fibonacci ratios. The patterns have animal names and odd labels (the Butterfly, the Bat, the Crab, the Gartley), and each one has specific ratios that must be met for it to be valid.
The idea: when a pattern completes at the right ratios, it forms a potential reversal zone where you can enter with a tight stop and a clear target. That makes it one of the more disciplined schools in terms of pre-defined entries and exits.
A simple walkthrough: price runs from X to A, retraces to B (often 61.8% of XA in a Gartley), continues to C, then D lands in a zone defined by XA and BC ratios. If D sits inside that box, the trader waits for reversal behavior inside the box. They do not jump early because the shape looked cute.
The nice part is that the stop is obvious: beyond X or beyond the far edge of D. Risk to reward is often decent if you wait for completion instead of guessing halfway.
But be careful: not every zigzag on the chart is a Bat. Respecting the ratios is a requirement, and a pattern without context (trend, key level) is worth little. There are tools that auto-draw these patterns, but blindly trusting them is a recipe for losses. Use the drawing as a filter, and the close plus price behavior as the decision.
Key concepts
- Exact Fibonacci ratios per pattern
- Gartley, Butterfly, Bat and Crab patterns
- The potential reversal zone (PRZ)
- Pre-defined risk-to-reward setups
Who is it for?
For people who love precision and clear rules, and don't mind waiting for a pattern to complete.