

Elliott Wave Theory
Markets move in waves, if you can count them
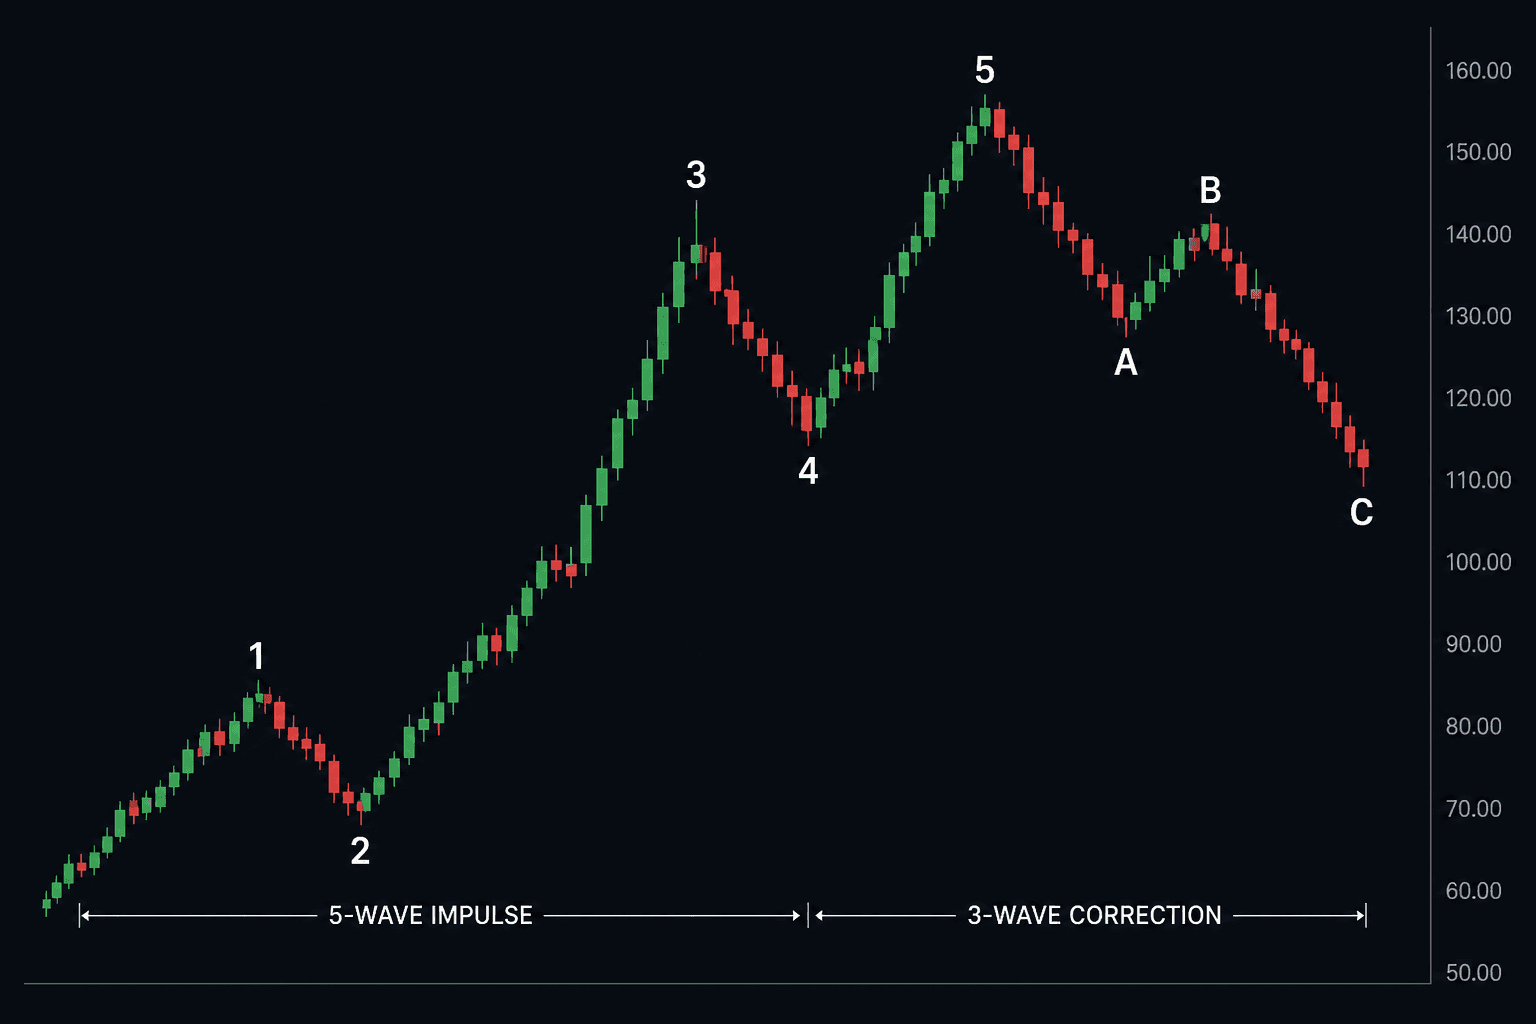
An old theory from the 1930s. It says crowd psychology moves markets in a repeating pattern: five waves with the trend, three corrective waves against it. And every big wave subdivides into smaller waves of the same shape.
Its strength is that it gives you a full map of the market: where we are in the cycle and what's expected next. It also pairs nicely with Fibonacci ratios for wave targets and correction zones.
On the picture, wave 1 starts the move, wave 2 is a pullback that should not break the start of 1, wave 3 is the strongest stretch (this is where beginners usually arrive late because they wanted extra confirmation), wave 4 is a quieter pause, wave 5 is the last push before fatigue. Then A-B-C starts eating profits if you insist on buying the high.
Some things are rules, not vibes: wave 2 does not break the origin of wave 1, wave 3 is not the shortest of 1-3-5, and wave 4 usually does not dive deep into wave 1 territory. If a rule breaks, the count is wrong. You adjust. You do not force the chart to flatter your count.
Its famous weakness is the count itself. Ten analysts can count the same chart ten different ways. That is why we recommend using it as one tool within your system, not the whole system. When a wave count lines up with strong support and a reversal pattern, that is when the picture gets convincing.
Key concepts
- Five impulse waves and three corrective waves
- Rules and guidelines of wave counting
- Fibonacci ratios for targets and retracements
- Wave nesting across timeframes
Who is it for?
For people who enjoy deep analysis and a big-picture view of the market, with patience for detail.